An important issue in IT Service Management is that of ITIL Continual Service Improvement (CSI).
The ServiceNow system already offers IT Service Managers numerous ways of analysis and reporting, in terms of the number and status of tickets according to various criteria like period of time, asset class, ticket type, priority and SLA compliance, for example. Unfortunately, key figures in a dashboard do not suffice for really understanding possible problems in procedures and for achieving continual improvement – the history behind those key figures must also be understood. ARIS Process Mining – a service solution from Software AG – fits precisely this need and moreover identifies automation potential.
Process Mining thus offers valuable support for understanding how the processes in IT Service Management are actually progressing – from a telescopic view down to a microscopic one – and how ITIL-oriented Continual Service Improvement can be achieved.
Source: own representation
As basic structuring in Process Mining, the perspective of end-to-end processes proves useful.
In practice, however, the actual subject of the Process Mining analysis is not an overall end-to-end process, but merely certain variants or sub-areas where a need or potential for optimization exists. In an Order-To-Cash end-to-end process, this can be (e.g.) the process variant in reference to a particular product or market segment – and in a Hire-To-Retire end-to-end process only individual sub-areas, such as the recruiting process, might be considered.
A corresponding area of consideration – a variant or a sub-area of an end-to-end process – is represented in ARIS Process Mining as itself a distinct project, with each project being assigned a self-contained data sector unconnected to the other projects.
In IT Service Management, we find ourselves in the so-called “Issue-To-Resolve” end-to-end process. The structure here is ideally based on the ITIL set of rules specifying the subdivision of the process variants into changes, incidents and requests. The Issue-To-Resolve end-to-end process also presents certain special features in other aspects.
While in most end-to-end processes, a relevant share of the added value comes from interactions within an application system, and very often a given process will involve several different application systems, things are somewhat different in the Issue-To-Resolve end-to-end process. There, value is added not in the IT Service Management system but at the particular asset or configuration item. Consequently, the IT Service Management system – in the present example, ServiceNow – is basically used only “between” the different operational steps involved in taking over a ticket for processing, changing the status of a ticket, assigning the ticket to a processing group or for communicating in reference to the ticket. The IT Service Management system thus serves primarily as a logging and communication platform. Accordingly, the system for Process Mining also generates usable digital footprints – primarily ticket status changes and processing group assignments.
Another special feature compared with other end-to-end processes, which also considerably reduces complexity, is that very often the complete Issue-To-Resolve process runs within a single application system, such as ServiceNow. In other words, generally only data from a single application system are needed in order to consider the overall process – in our example, the change process.
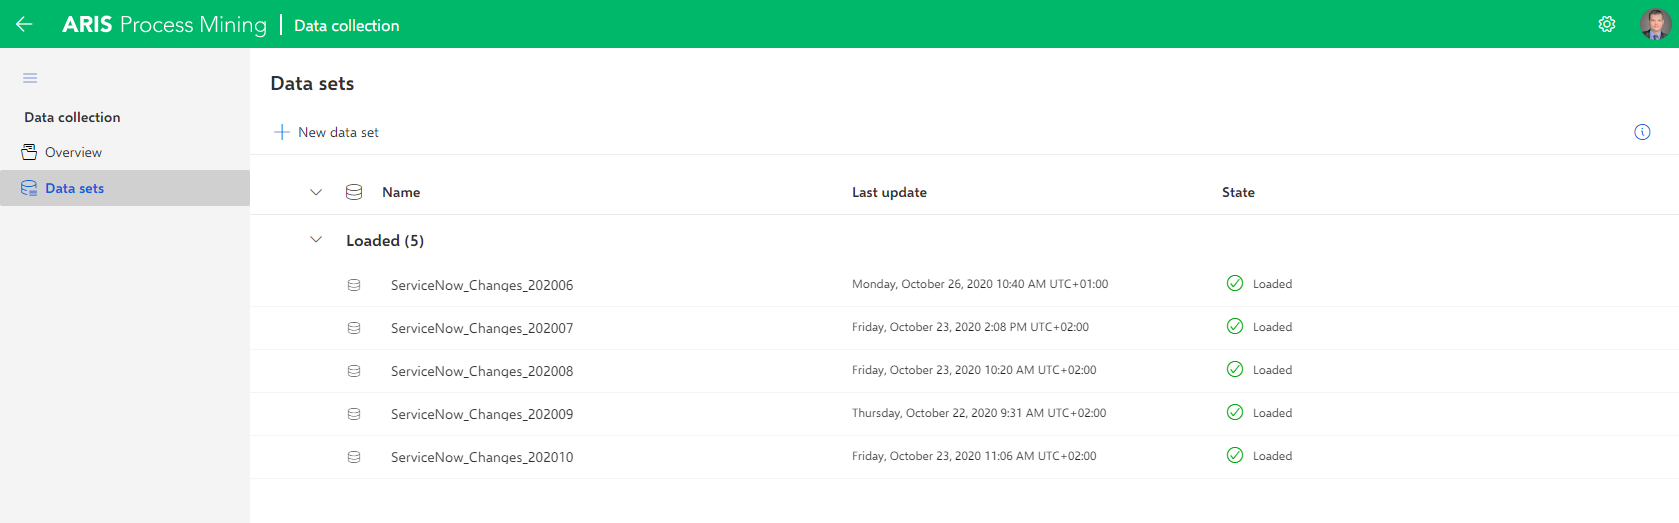
As the next step. we consider the data underlying the Process Mining analysis. Here we’ve selected the item “Data Collection”:
Source: own representation
Creating a Process Mining analysis or updating an existing analysis with new data is possible by importing the corresponding CSV files to the system.
In terms of temporal structuring, a monthly analysis in IT Service Management is a good idea, among other things, since compliance with service levels regarding customers is also determined and reported on a monthly basis.
Source: own representation
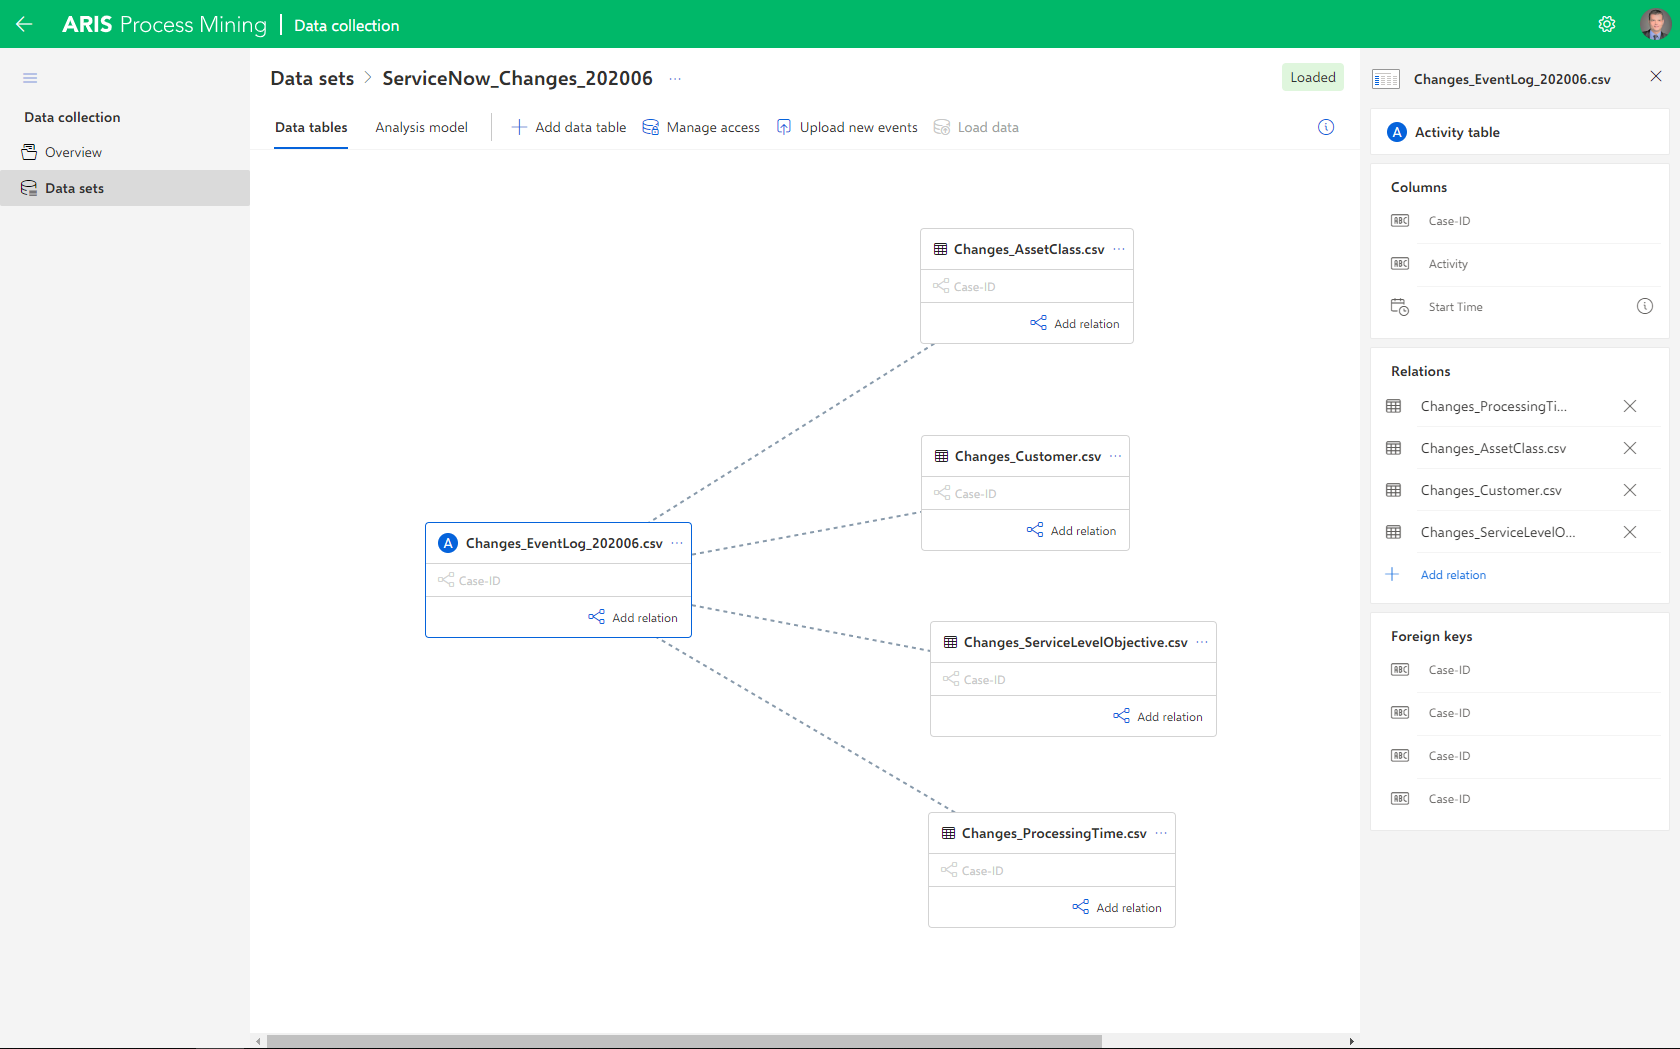
In the present example, 5 files are imported each month. The most important file is then the event log, which contains for all change tickets the respective case IDs and as well as all activities with their corresponding time stamps. For generating this event log from ServiceNow, you must first define the types of events relevant for the Process Mining analysis. In the present example, both the change in ticket status and the change in assignment group are identified and defined as events relevant for the analysis.
Further information, mapped via the case ID, in our case namely the change ticket number, can be added by means of extension tables. In the present example, this is the asset class, the particular customer, the particular service level target and the particular processing time yielded by the sum of the cumulative labor times for the individual change tasks. The extension tables allow adding arbitrary other analysis-relevant ticket-related information as required, such as priority levels, of interest in incident processes, for example.
Moreover, the possibility of arithmetical computations within the data records also allows determining additional data important for process control, such as the process costs yielded from multiplying processing times by labor rates.
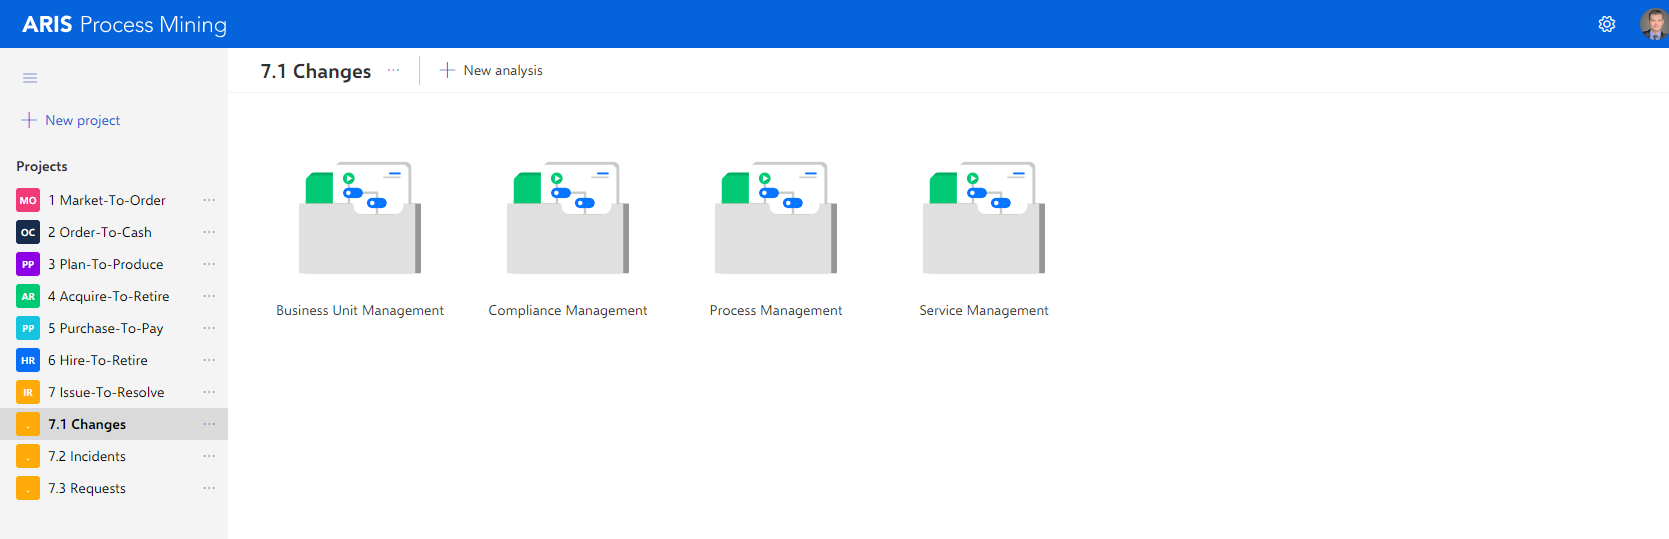
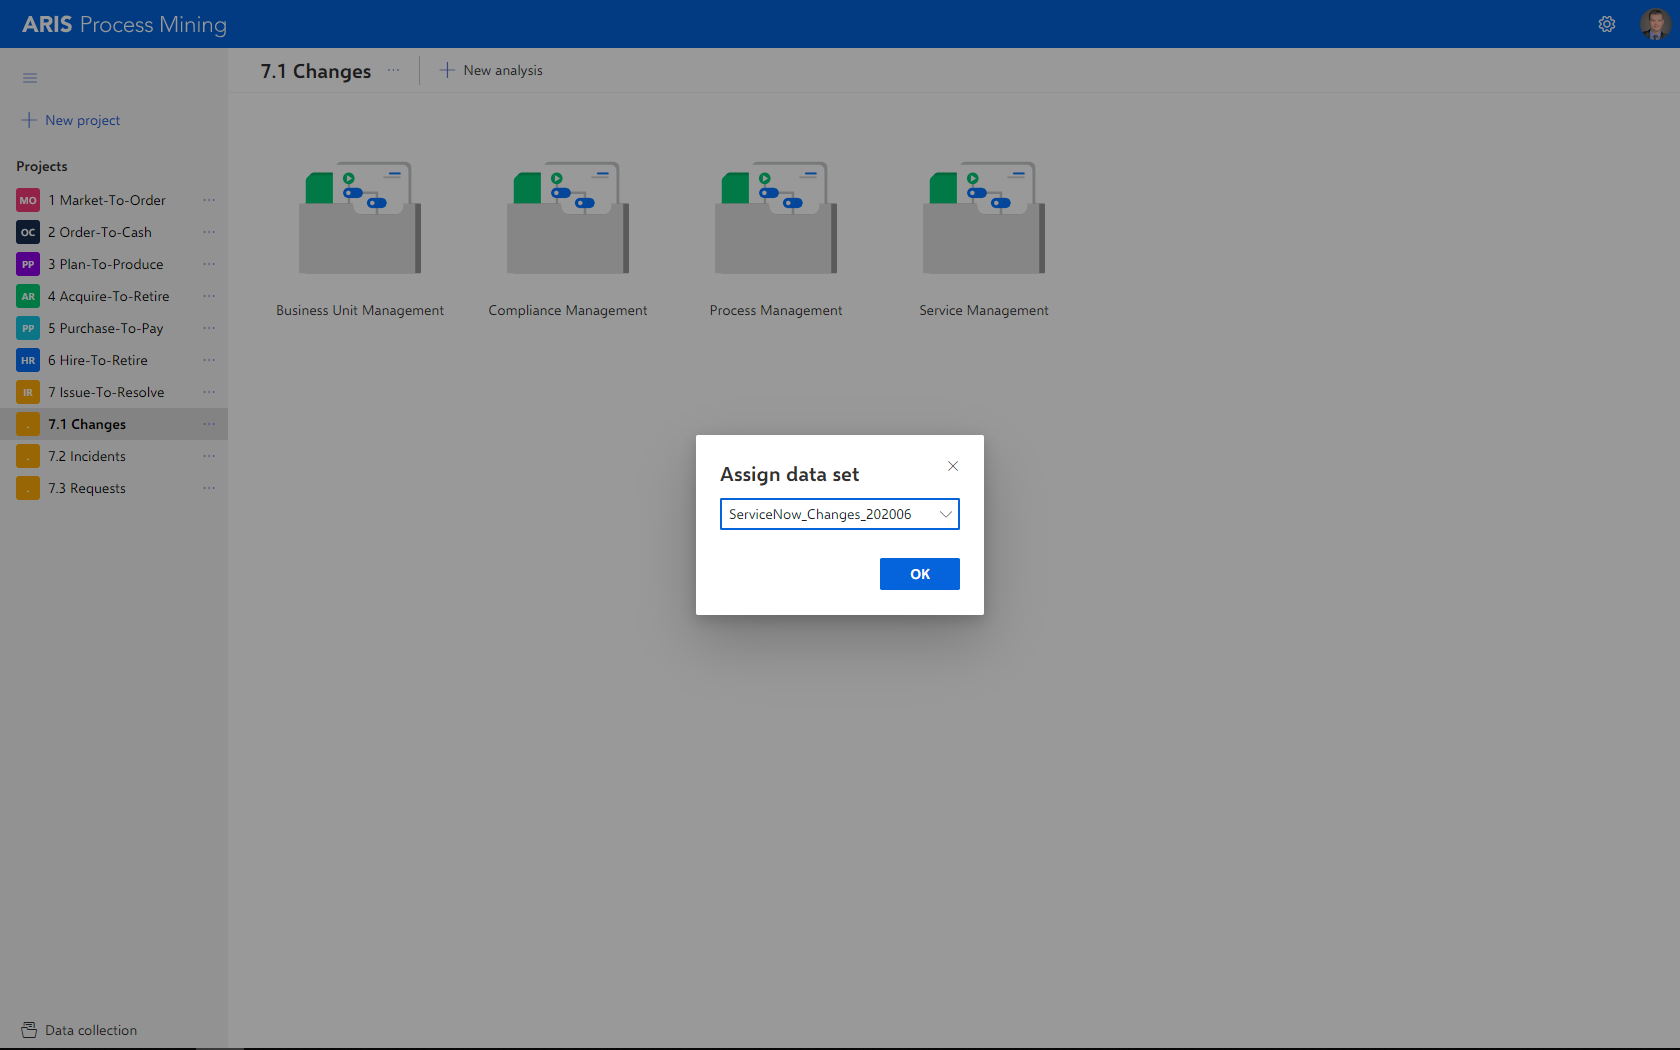
Let’s now return to our initial screen and select our Issue-To-Resolve process variant “Changes”.
The first step determines the period of the analysis and assigns to the entry “Changes” the data from the month of June 2020:
Source: own representation
Based on the assigned data, various analyses can now be created.
The analyses themselves serve as different points of interest for different stakeholders, such as business unit managers, compliance managers or auditors, process managers and service managers. In our example we now consider the “Business Unit Management” perspective, which affords a comprehensive overview of all basic aspects of the process analysis.
Source: own representation
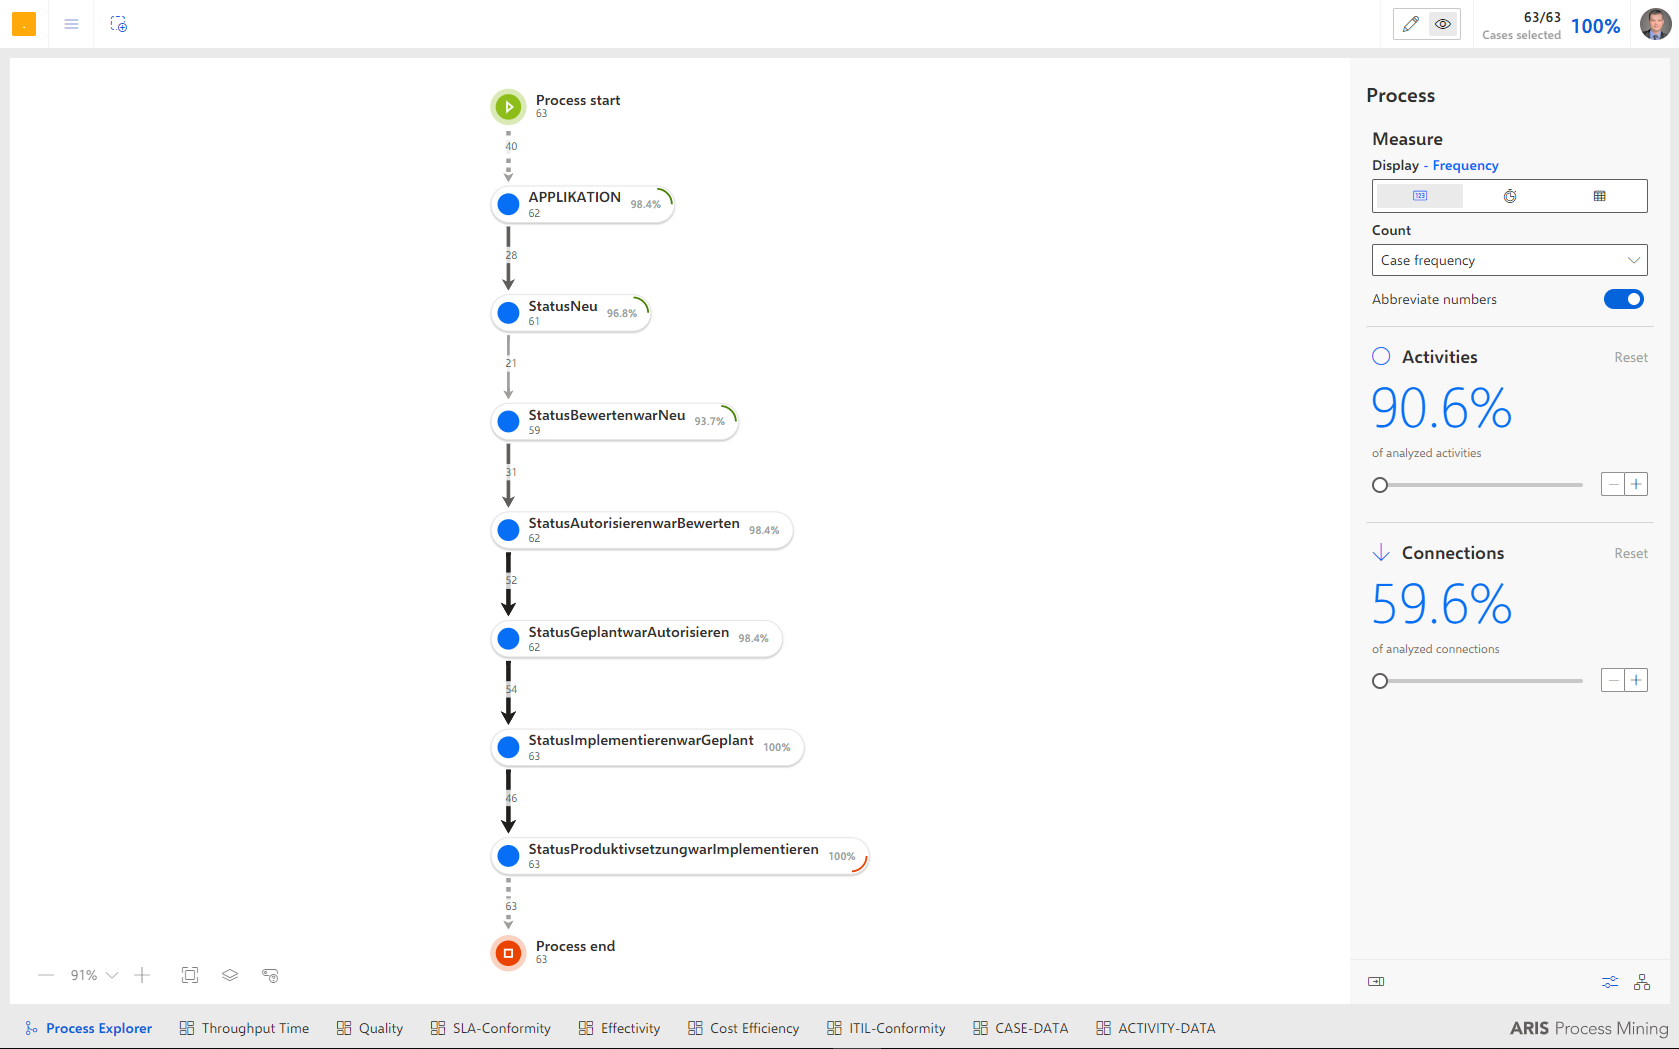
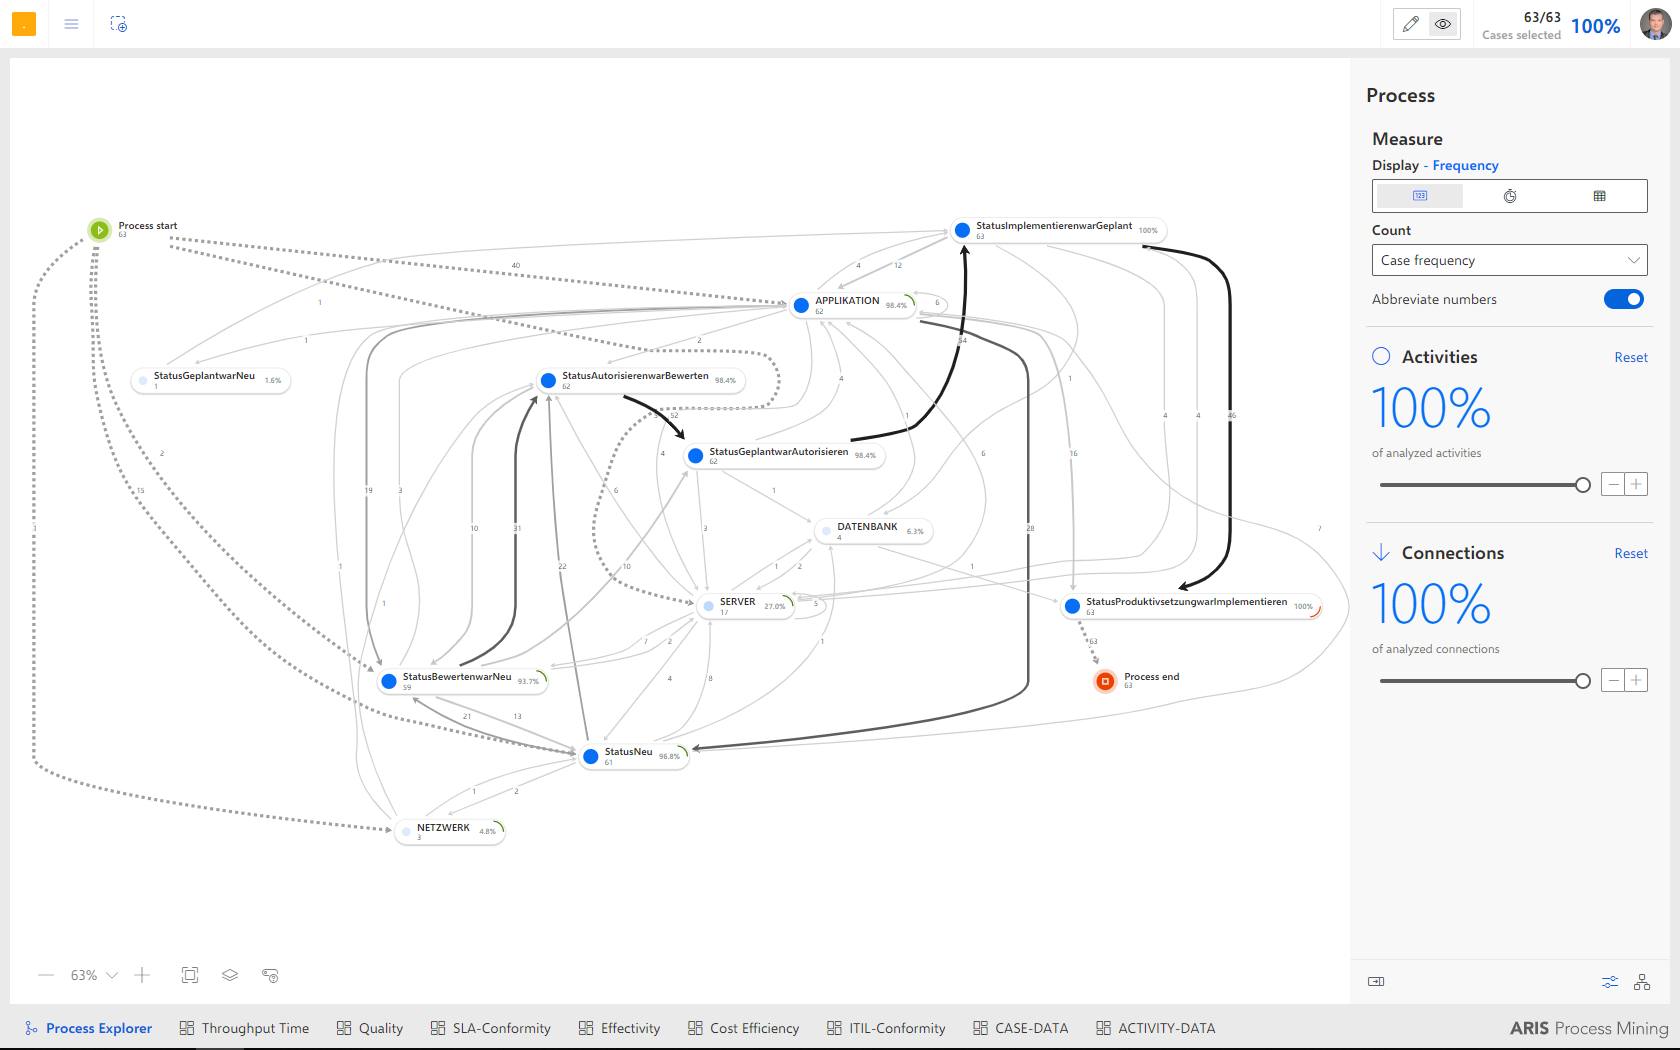
The initial view in our “Business Unit Management” analysis is the Process Explorer. The process steps stored in ServiceNow are compiled and the process as actually running is displayed. The implicit and otherwise hidden process knowledge contained in the data then becomes tangible and the process is reconstructed purely on the basis of digital footprints.
In contrast to the EPC or BPMN model, also available in ARIS, we see here how the change management process proceeds in reality, i.e. which process steps occur in which ticket and in which order.
The process as initially represented should ideally correspond to the variant of the process flow often designated as the “Happy Path” or “Gold Standard”. The greater the percentage of activities and connections, the better, since fewer deviations from this Gold Standard process occur.
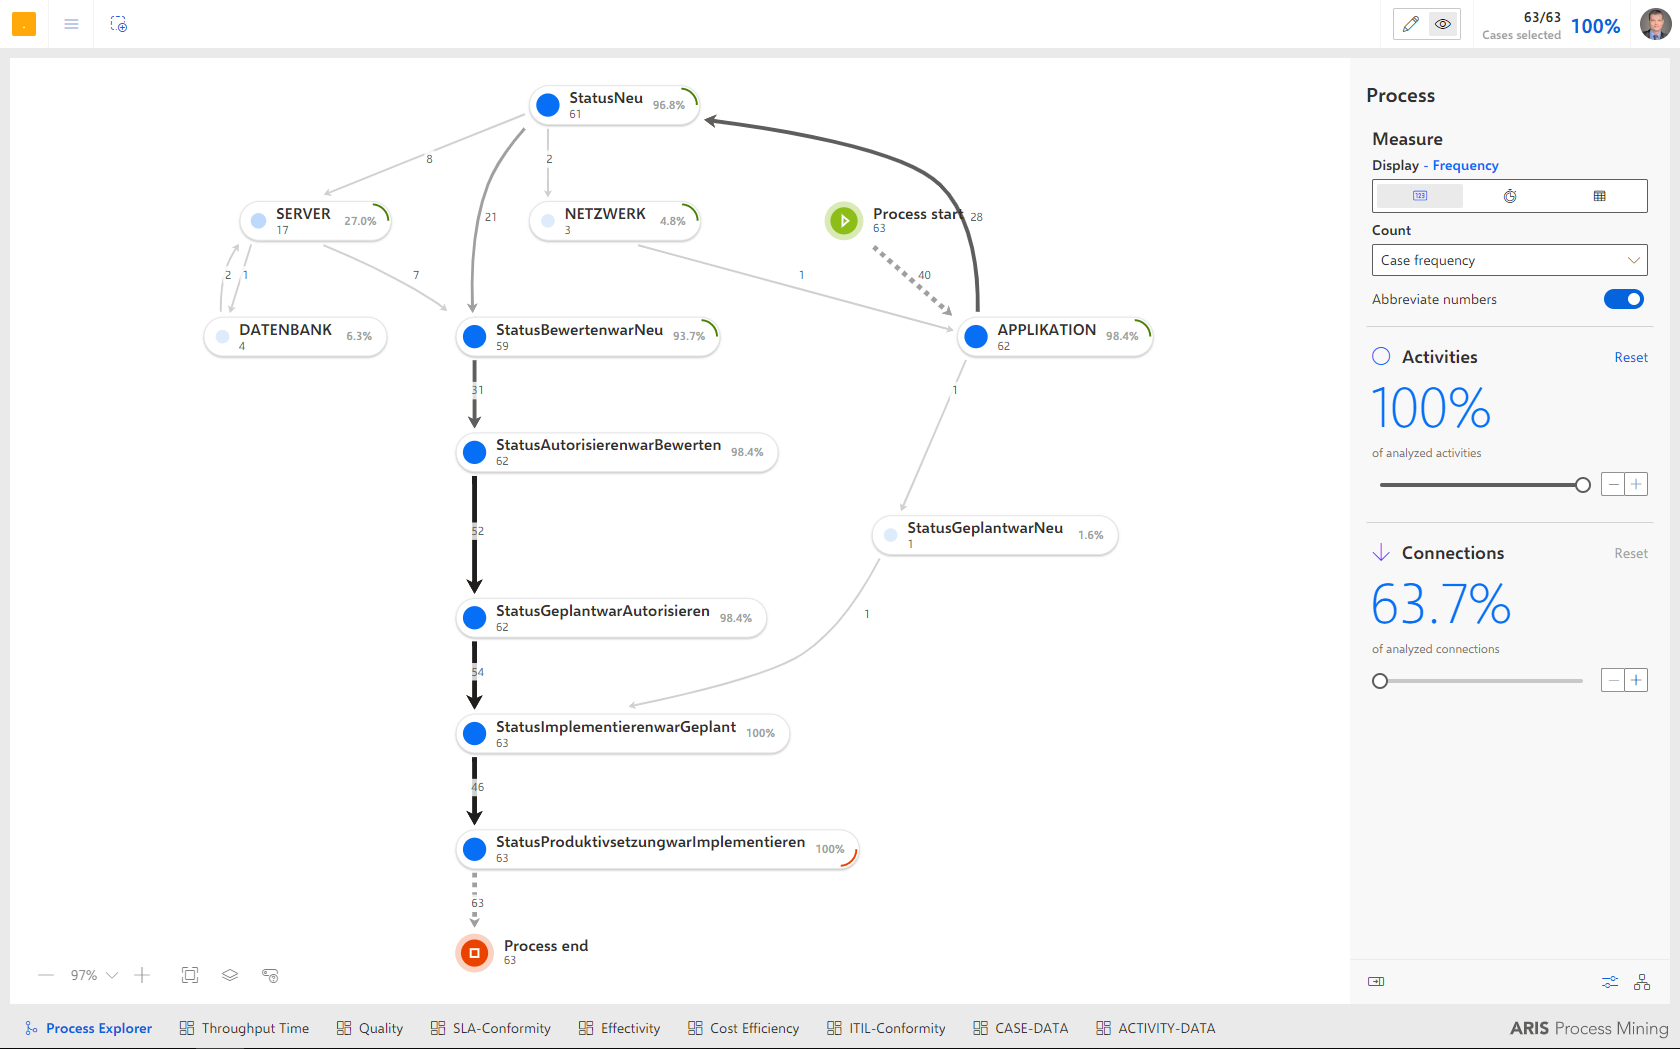
Increasing the share of the represented activities renders successive further process variants visible and possible issues transparent.
Source: own representation
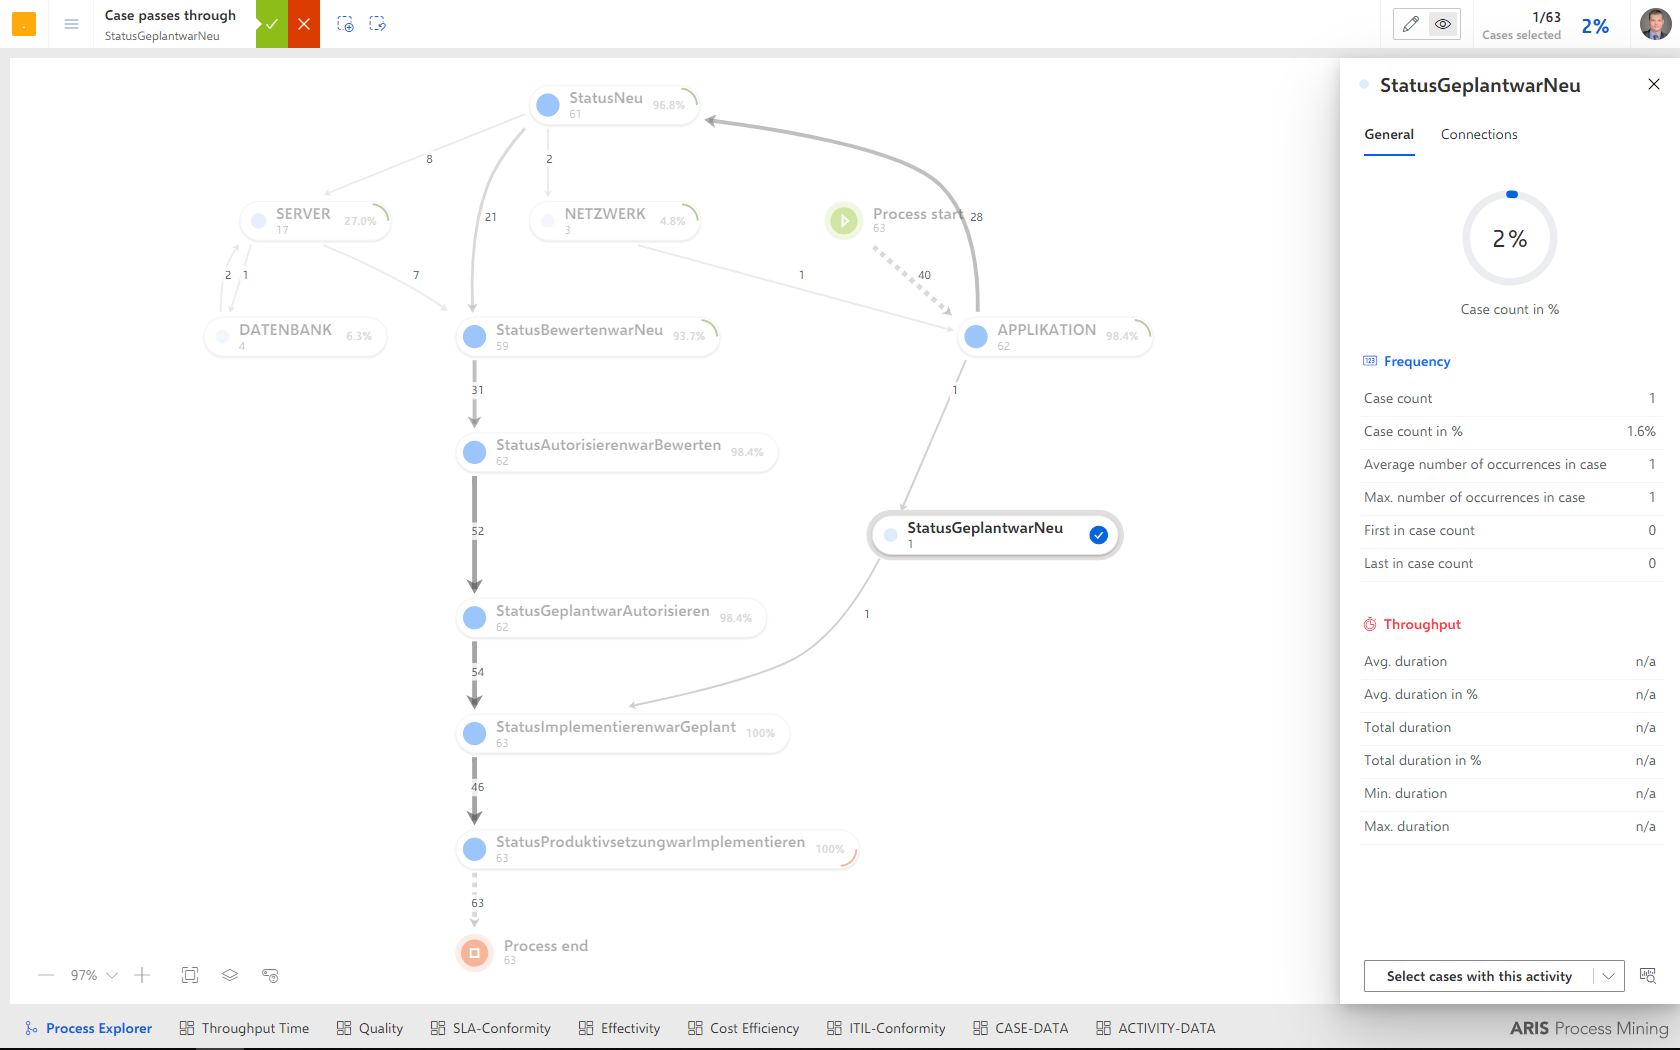
One problem that now becomes visible is a change implemented without prior approval. Let’s now take a closer look at this case.
Source: own representation
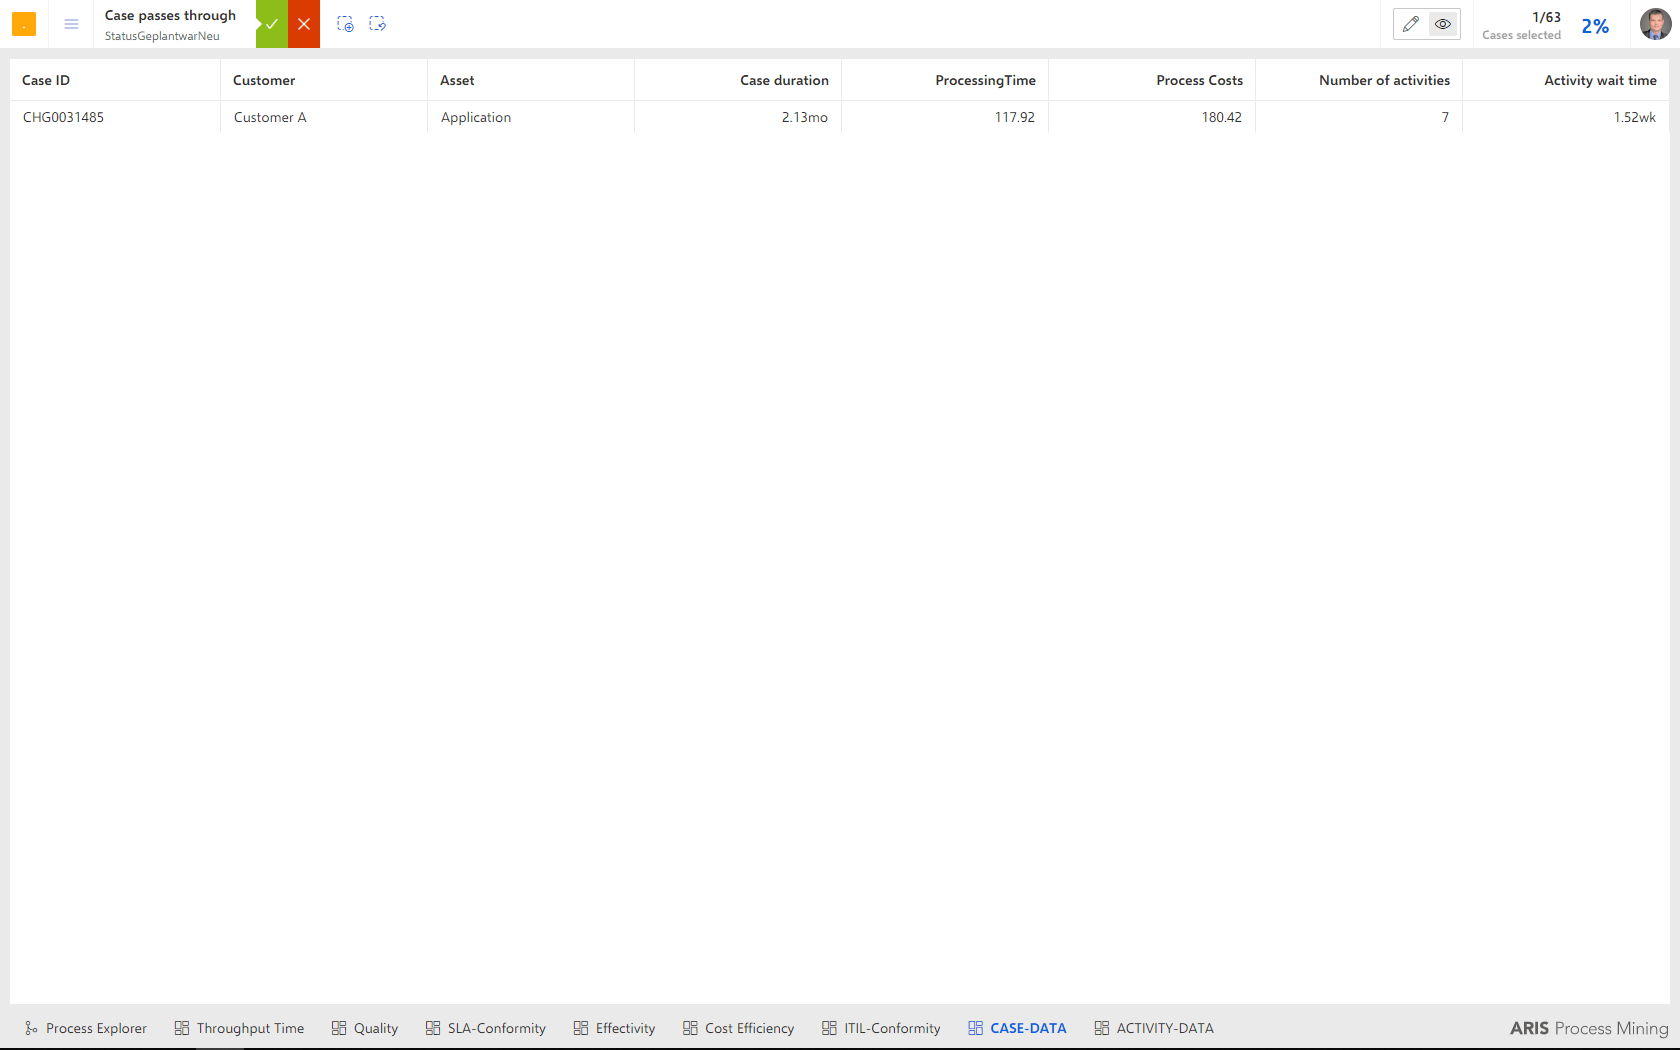
Simply clicking on this path applies the corresponding filter, so that we can immediately identify the ticket in question – displayed in the “CASE DATA” app:
Source: own representation
That ticket is “CHG0031485”; undoing the filter displays all cases in this app again:
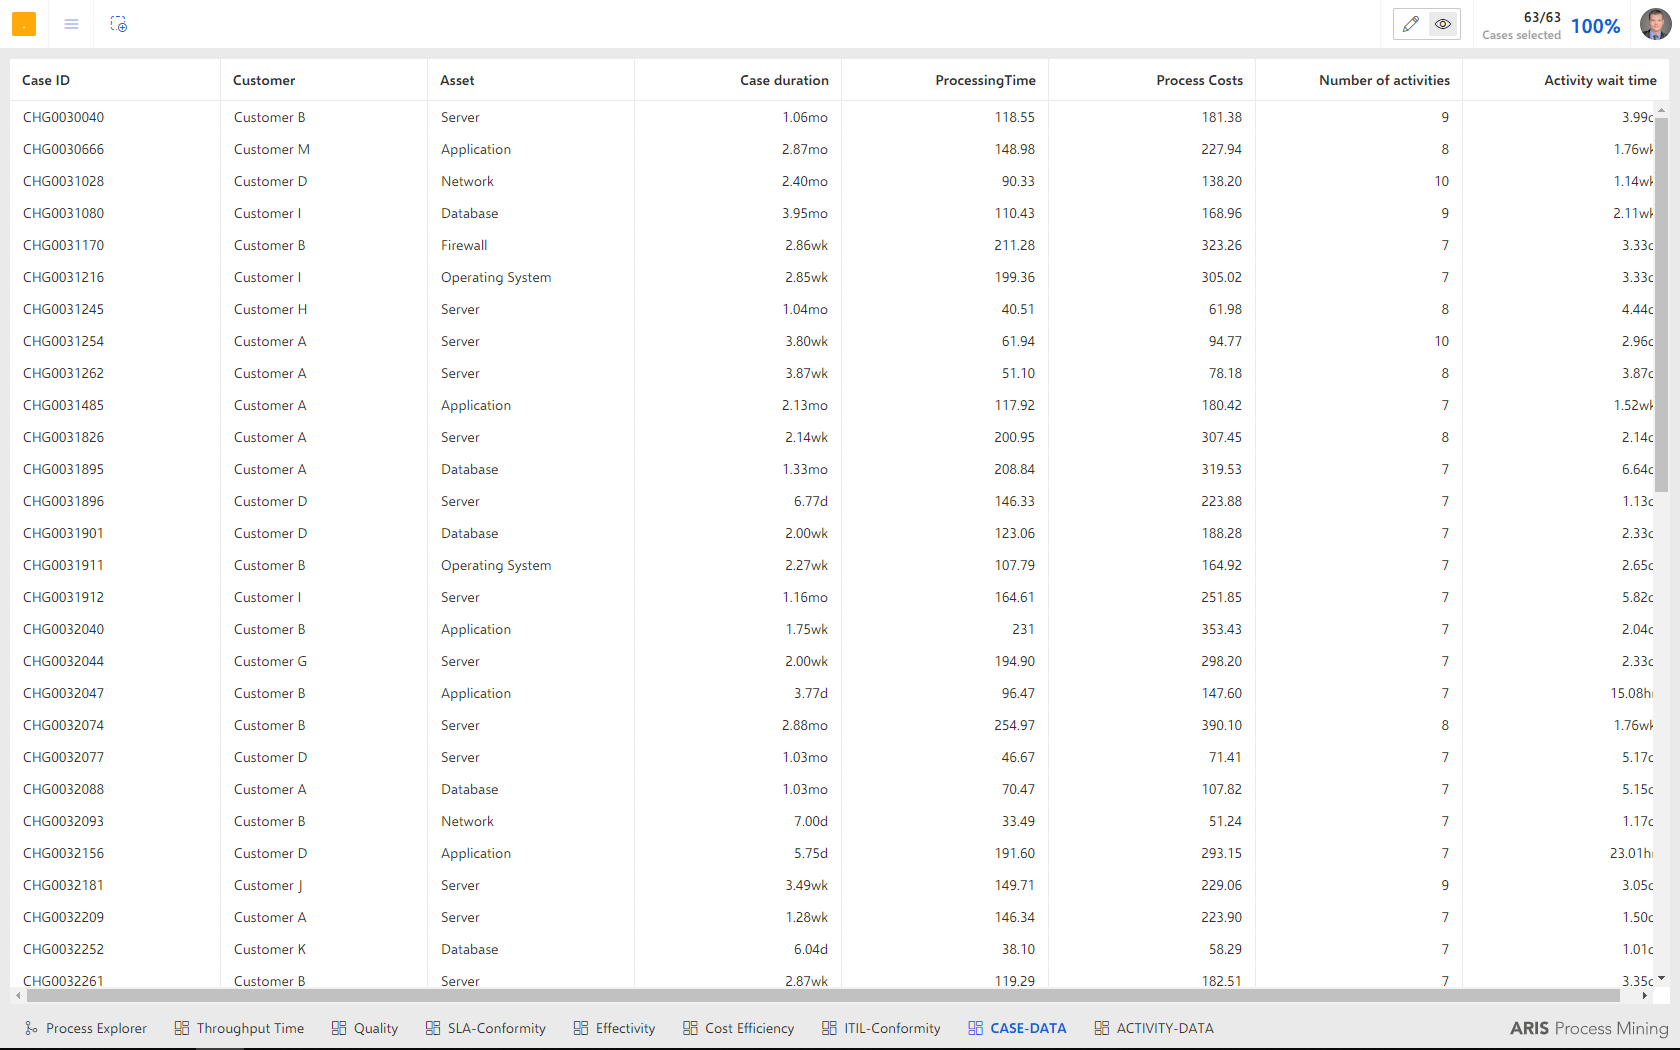
Source: own representation
The share of displayed connections can be successively increased, generally resulting at 100% in kind of a “spaghetti chart”.
Source: own representation
“Reset” returns us to our gold standard process, and we next consider other apps.
Our “Business Unit Management” analysis has the following analysis apps at its disposal.
- Throughput time as the period between customer contact points, .i.e. from change request to change implementation
- Quality measured in terms of error rate due to non-acceptances, appointments missed or complaints
- SLA conformity as the result of service level compliance, i.e. the difference between the service level target and the throughput time
- Effectiveness measured by the success rate on the basis of idle performance in the form of non-approvals and process cancellations
- Cost efficiency based on the process costs
- ITIL conformity through consideration of non-ITIL compliant process deviations
We next consider in detail the app for analyzing the throughput time.
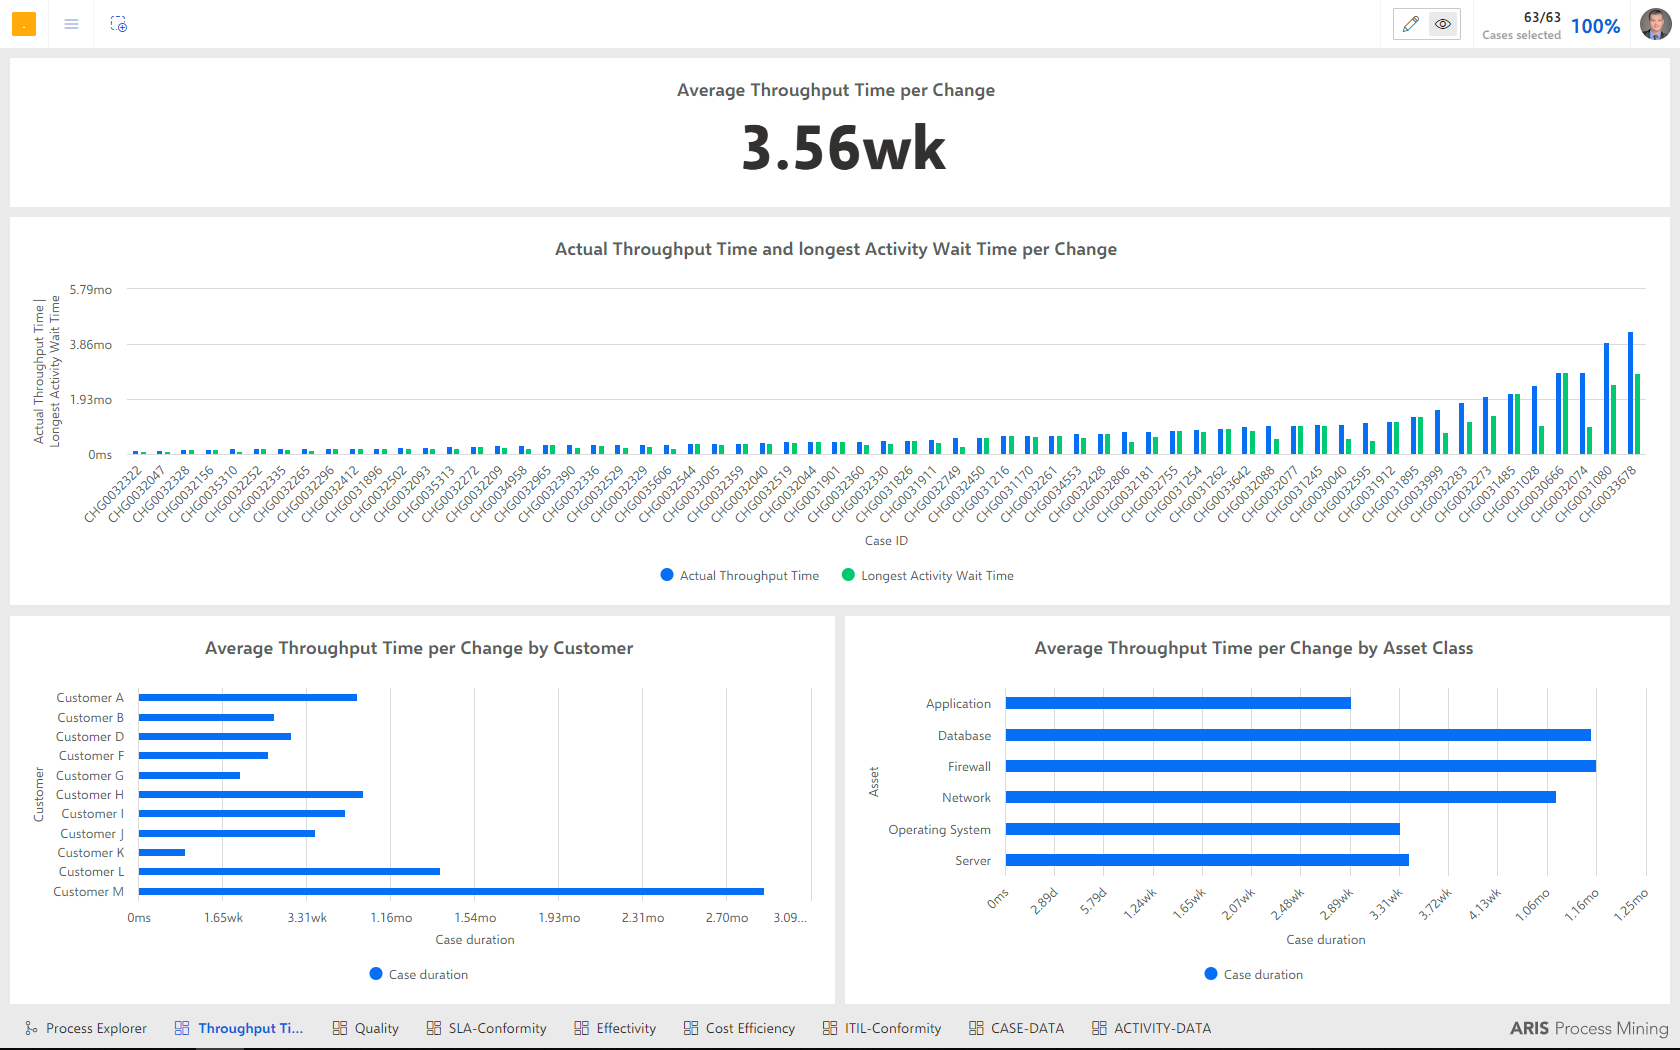
Source: own representation
The central key figure here is the average throughput time over all change tickets in the period under consideration. This period is currently 3.56 weeks. The bar chart here displays the total throughput time per change together with the respective highest individual activity wait time.
A glance reveals any outliers, which can be viewed in detail through filtering.
By selecting the corresponding bar in the chart, we can now view the change with the highest throughput time. The corresponding filter is then set across all apps and the corresponding process flow appears, which we can now see in the Process Explorer. Since evidently there is a problem with the throughput time, we now switch to the corresponding key figure view.
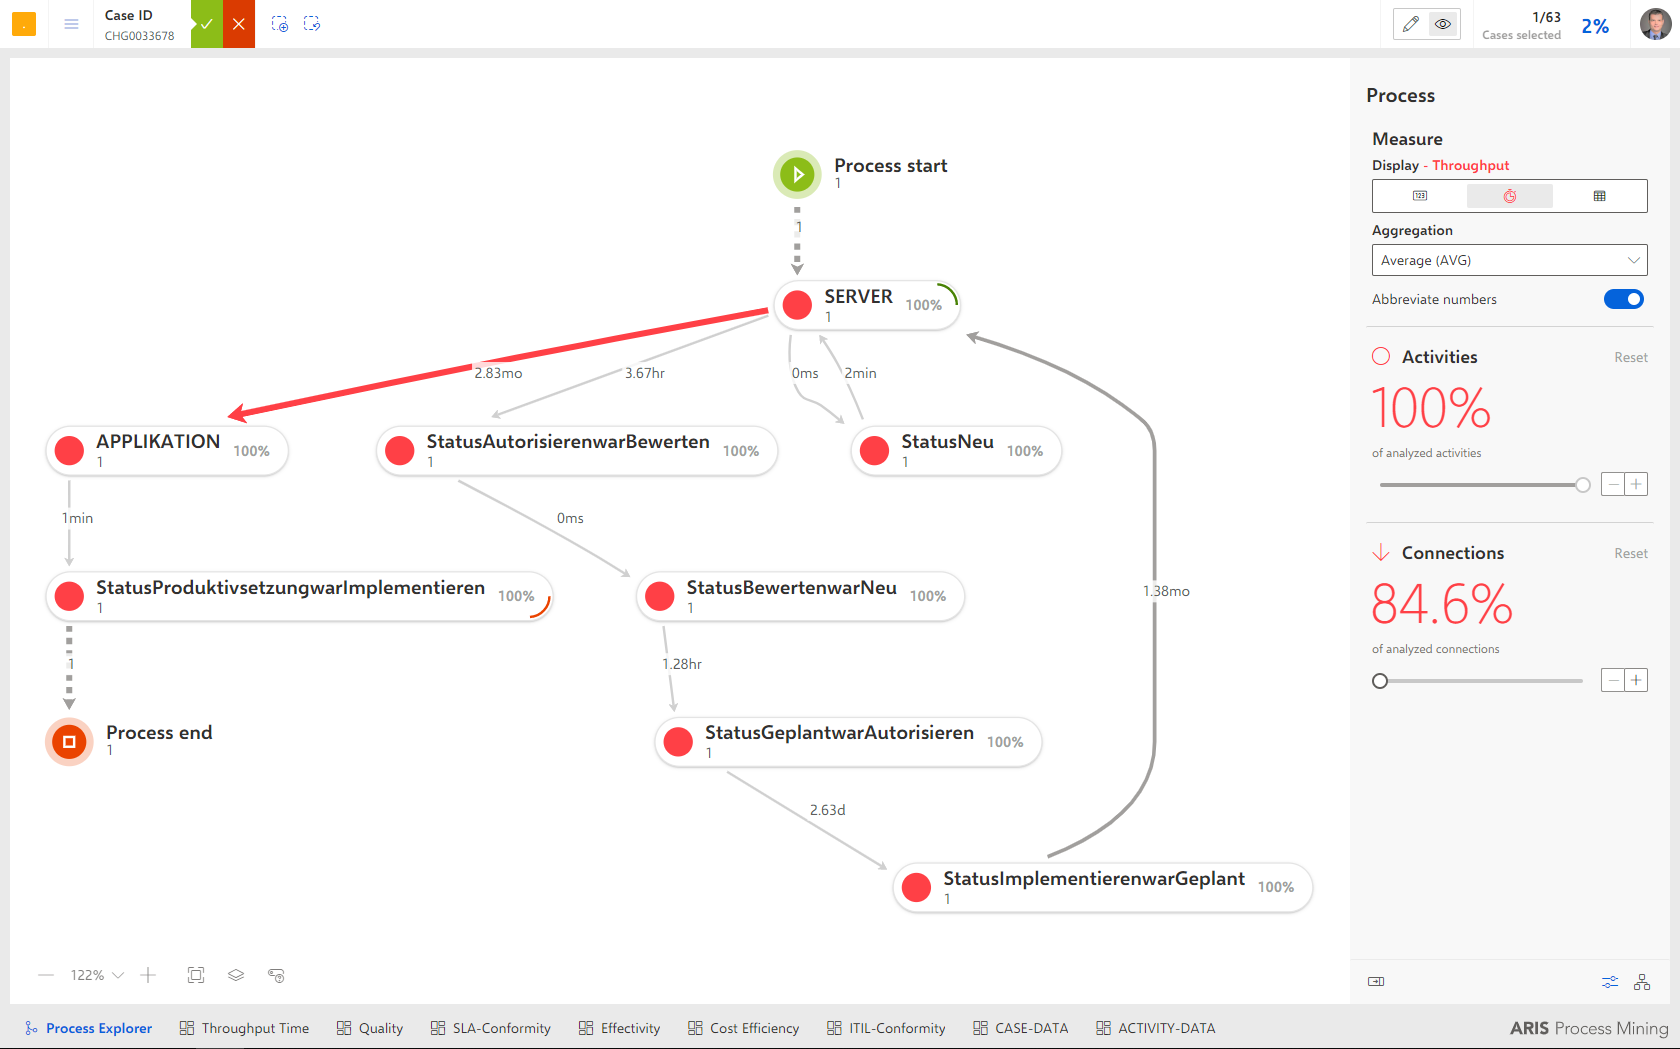
Source: own representation
The color-highlighted connection indicates that the ticket has been forwarded to a different assignment group, with a delay of 2.83 months.
Removing the filter, we return to our default process and consider the “Cost Efficiency” app.
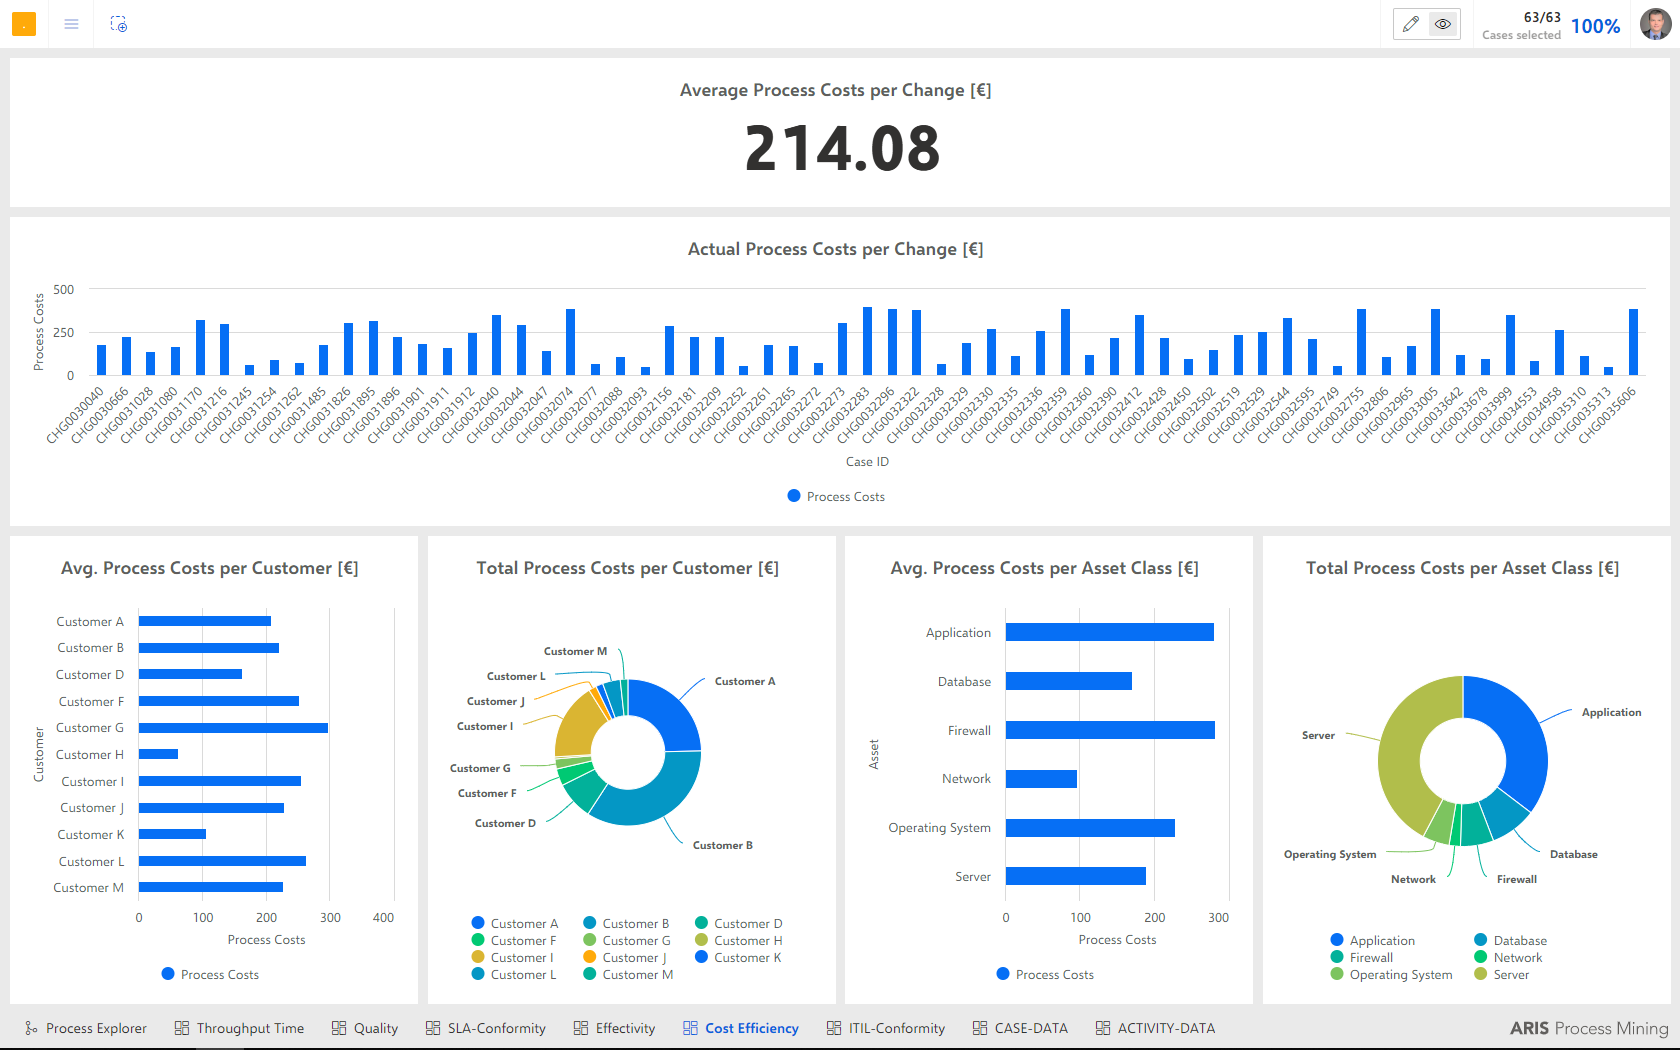
Source: own representation
The focus again lies on a number as a basic indicator – in this case, the average process costs per change. The graphic analyses available in this app are specifically:
- the process costs per change
- the average process costs per customer
- the total process costs per customer
- the average process costs per asset class
- and the total process costs per asset class
Overall, the apps can be created and arranged very easily and intuitively, which makes ARIS Process Mining a very flexible tool for implementing ITIL Continual Service Improvement purposefully and effectively in everyday work.